Financed-emissions data structure
1. Why we need a data model
Section titled “1. Why we need a data model”To calculate financed emissions we always answer three questions:
- Who/what is emitting?
- How big is my slice of that emitter?
- How much CO₂ does my slice represent?
Answer 1 lives in emissions data, answer 2 in valuation & exposure data, and answer 3 is the result. The model below stores each piece once, in a reusable way, no matter whether the asset is a listed share, a mortgage, or a sovereign bond.
2. Main building blocks
Section titled “2. Main building blocks”| Concept | Think of it as… | Typical examples |
|---|---|---|
| Counterparty | The legal entity or household you finance | Company “Tesla Inc.” or Household #A123 |
| Asset (Exposable) | The thing that causes emissions | A share (security), a property, a vehicle, or a country |
| Exposure | Your slice of the asset on a given date | “We own 1,000 Tesla shares worth €200 000” |
| Emission Record | CO₂ numbers for that asset or entity | “Tesla emitted 4.2 MtCO₂e (Scope 1+2) in 2024” |
| Valuation Record | What the whole asset was worth | “Tesla’s EVIC was €550 bn on 31 Dec 2024” |
| Financed Emission | The result row | “Our Tesla holding finances 1 529 tCO₂e” |
| Reference data | Currencies, FX rates, data-provider list | € ↔ $ rate, “Company-Reported” vs “Modelled” |
3. How the pieces connect
Section titled “3. How the pieces connect”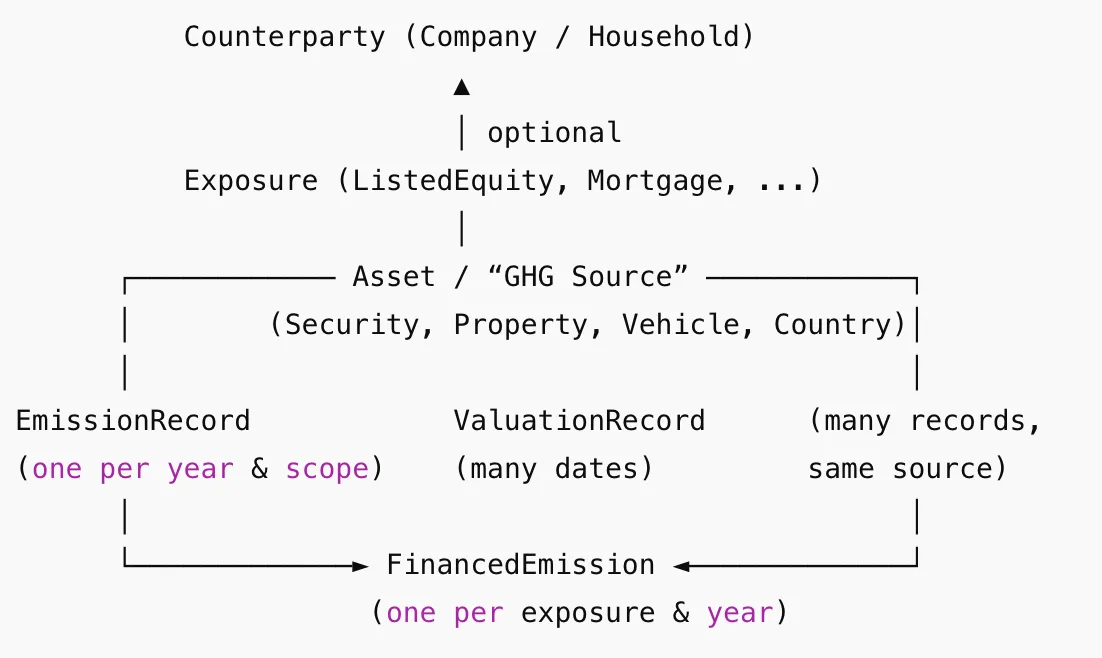
4. What’s in the tables (jargon-free)
Section titled “4. What’s in the tables (jargon-free)”| Table | Key columns you’ll see in reports |
|---|---|
companies |
Name, country, NACE sector code |
households |
Anonymised ID, country |
securities |
ISIN, equity / bond flag, linked company |
properties |
Address/ID, floor area, energy rating |
vehicles |
VIN, fuel type |
countries |
ISO-3 code, name |
exposures |
Type (share, loan…), outstanding amount, currency, valuation date, contract number & maturity for loans |
emission_records |
Year, scope (1-3), tCO₂e, data quality score, provider (“Reported” or “Modelled”) |
valuation_records |
Date, amount, currency, basis (EVIC, appraised value, GDP…) |
financed_emissions |
Year, scope, attribution factor, financed tCO₂e, reporting currency |
5. Two concrete examples
Section titled “5. Two concrete examples”A. Listed-equity holding
Section titled “A. Listed-equity holding”| Step | Data row | Example value |
|---|---|---|
| Asset | securities |
ISIN US0378331005 – Apple share |
| Counter-party | companies |
Apple Inc., NACE C-26.30 |
| Your slice | exposures (type = ListedEquity) |
1 000 shares, €150 000, valued 31 Dec 2024 |
| Whole-company emissions | emission_records |
2024, Scope 1+2 = 47 000 tCO₂e, provider = “Company-Reported” |
| Whole-company value | valuation_records |
31 Dec 2024 EVIC = €2 000 bn |
| Result | financed_emissions |
Attribution factor 0.000075 → 3.5 tCO₂e financed |
B. Residential mortgage
Section titled “B. Residential mortgage”| Step | Data row | Example value |
|---|---|---|
| Asset | properties |
Property ID LV-RIG-12345, energy class C |
| Counter-party | households |
Household #H6789, Latvia |
| Your slice | exposures (type = Mortgage) |
Outstanding €120 000 on 31 Dec 2024 |
| Property emissions | emission_records |
2024 Scope 1 (gas heating) 2 tCO₂e, provider = “Modelled” |
| Property value | valuation_records |
31 Dec 2024 appraisal €200 000 |
| Result | financed_emissions |
Attribution factor 0.60 → 1.2 tCO₂e financed |
(Numbers are illustrative only.)